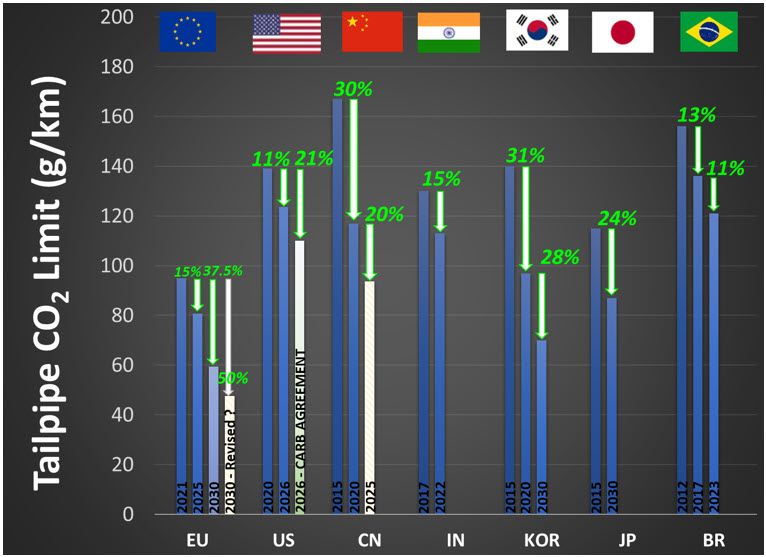
Hydrogen Fuel Cell Trucks
![]()
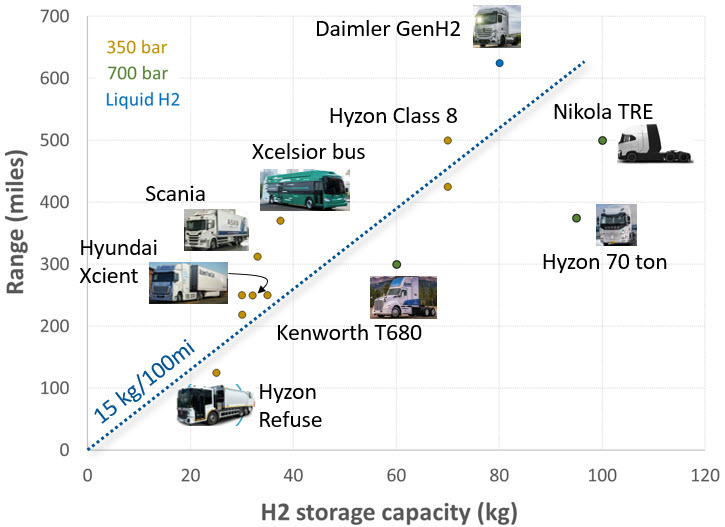
An updated summary of available hydrogen fuel cell electric trucks and buses, their announced range and hydrogen capacity.
![]()
An updated summary of available hydrogen fuel cell electric trucks and buses, their announced range and hydrogen capacity.
![]()
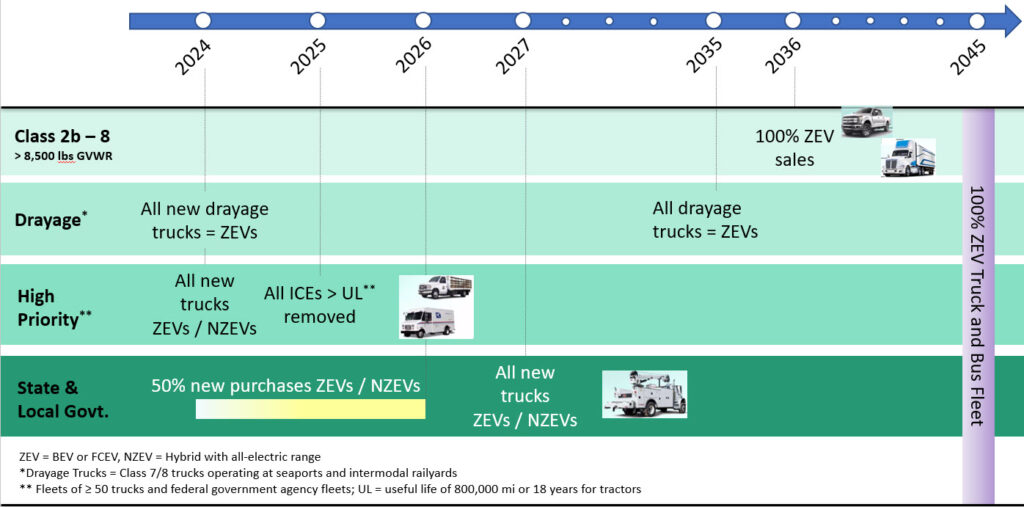
A summary of CARB’s latest Advanced Clean Fleets proposal for heavy-duty truck electrification as discussed in the February 2023 Workshop.
![]()
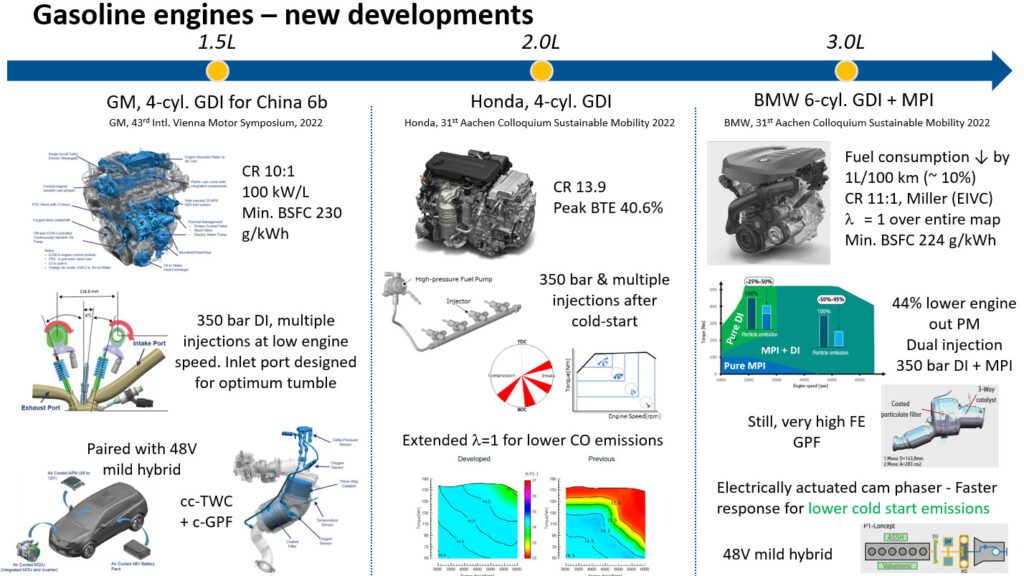
Yes, OEMs continued developments of new gasoline engines in 2022. Here’s a short write-up of key technologies added covering a range of 1.5L to 3L engines.

![]()
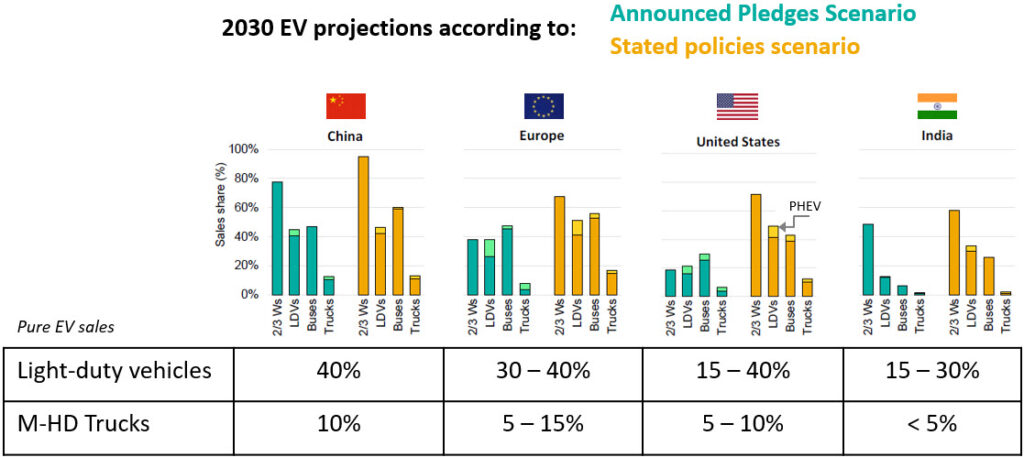
What’s better than a long-term EV outlook? Two outlooks, both published in the same month. Here’s a quick comparison of some of the important aspects pertinent to the rate of electric vehicle uptake.
![]()
Highlights from the International Energy Agency (IEA) annual outlook on electric vehicles, and the associated view on the batteries and infrastructure needed to 2030.

![]()
The US EPA has revised the fuel economy standards for model years 2023 – 2026. On average, this will require fleet averaged annual reductions of CO2 or fuel consumption by 7%. Overall, the model year 2026 CO2 emissions will be further reduced by 23% compared to the previous Safer Affordable Fuel-Efficient (SAFE) rule.

![]()
As we enter into the final lap of the SuperTruck 2 program, all teams are confident of meeting the 55% BTE and doubling-of-freight-efficiency targets. Here are the technical solutions being pursued.
![]()
Let’s put things in perspective first. Brake thermal efficiency was ~ 35% in 1960. In 2020, Weichai announced a 50% BTE commercial engine (more details on Dieselnet). And the US Department of Energy’s SuperTruck 2 program is targeting 55% BTE next year. At least two participants announced this year that they are close to 53%. Navistar, Book chapter in “Alternative Fuels and Advanced Vehicle Technologies for Improved Environmental Performance”, 2014 doi:10.1533/9780857097422.2.225 Here are some enabling technologies that the participants are pursuing to achieve 55% BTE and doubling of freight efficiency. Improvements include those at the engine, transmission and vehicle level. Also included are model based control of the drivetrain and emissions systems. The table below shows some of the options being evaluated by each of the participants at the engine level. Common elements include light thermal barrier coated pistons, high compression ratios, Miller cycle, high efficiency turbochargers, waste heat recovery and close-coupled SCR. The program enters its final year and we will see whether the participants can demonstrate achieving the targets at the DOE Annual Merit Review in 2021. See you there.
![]()
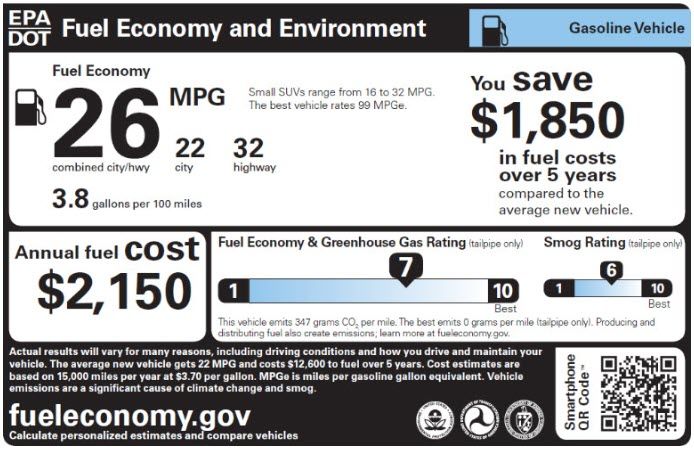
How is vehicle fuel economy (mpg) measured in the US ? Ever wonder how those city / highway MPG (miles per gallon) numbers on the sticker come from ? Here you go. The US EPA requires vehicle fuel consumption to be measured using lab chassis dynamometer testing. A representative vehicle is run over five test cycles, listed below along with the respective ambient temperatures: FTP-75 at 75 F: Represents city driving. Includes 3 measurements called bags (because the emissions are collected in bags !), with the first bag after a cold start (>12 hour overnight “soak”) and a hot start with engine off for only 10 min. HFET at 75 F: Highway fuel economy test US06 at 75 F: High speed and aggressive urban driving SC03 at 95 F: Represents the impact of air conditioner use at high temperatures Cold FTP at 20 F : Impact of cold ambient temperatures The above tests measure the fuel consumption over a wide range of driving conditions and provide a realistic assessment of on-road performance to the consumer. Note that till a few years back, only two cycles were used to measure the fuel economy: FTP-75 and HFET. Miles per gallon numbers from