Fuels
On the carbon intensity of ethanol
One of the fastest ways to decarbonize transport is to reduce the carbon intensity of the fuel – whether it be through use of renewable electricity for increasing share of battery powered vehicles, or fossil fuels for majority of the fleet today. Major countries have set CO2 targets for light- and heavy-duty vehicles, but these aim to regulate fuel consumption through tailpipe-standards. The true extent of decarbonization and the success of these policies can be measured through a well-to-wheel (or better still a cradle-to-grave) analysis including the carbon intensity associated with production of the upstream fuel.
To reduce its carbon footprint, gasoline is routinely blended with up to 10 – 15% of ethanol, with even higher levels available (85%) for flex-fuel vehicles. Heavy-duty engines are also developed to run exclusively on ethanol, with performance similar to diesels. Ethanol is even being considered as a feedstock for sustainable aviation fuels (SAFs). In countries such as Brazil and India, the addition of ethanol is further seen as a way to reduce dependence on imported oil.
It is important, of course, to assess the carbon intensity of this fuel. Many debates rage about the correct intensity – naturally so, given the various inputs that go into such a calculation, including farming practices, quantity and type of fertilizer, processing to make ethanol, any by-products, land use change, and of course the end use efficiency, etc. This article doesn’t provide a definitive answer but covers some recent developments on the topic.
Image : AI Generated using Canva
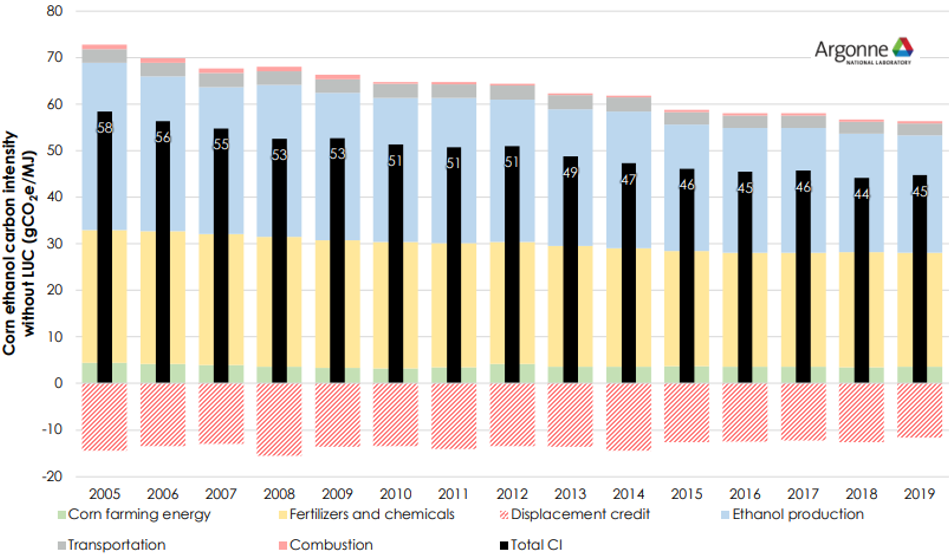
The trigger is the recent release of the latest version of Argonne National Lab’s GREET model, which can be downloaded and used to assess the effective well-to-wheel CO2 emissions for a variety of fuel and vehicle combinations.
Argonne has been tracking the inputs associated with ethanol production, showing that the carbon intensity reduced by 23% from 2005 – 2019 (see picture on left).
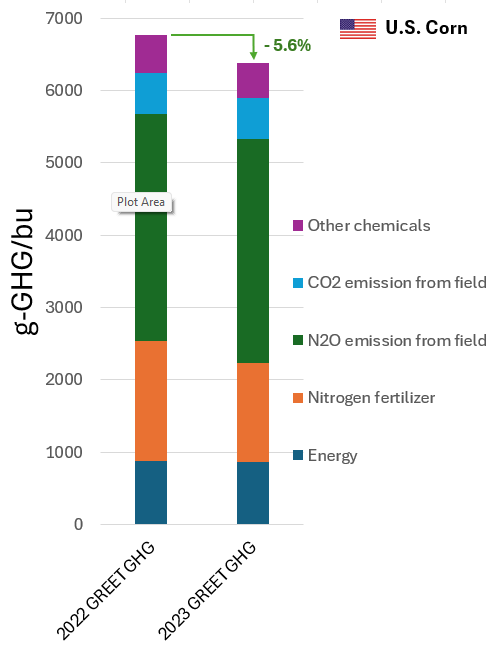
The improvement continues – the latest version of the GREET model revised the carbon intensity of U.S. corn farming by 5.6%, the reduction primarily coming from the fertilizer. The picture on the right shows this comparison of greenhouse gas emissions related to U.S. corn farming, expressed in g-GHG/bushel.
The left plot above shows the carbon intensity of ethanol but without the land use change (or LUC, basically accounting for GHG emission penalty attributed to the use of land for ethanol production vs. something else).
Several studies have looked into LUC and have tracked the total carbon intensity over time, and a recent study by MIT, Tufts University and Harvard has summarized and analyzed these prior estimates. The summary is shown below in the left plot. A critical assessment of these previous studies was done and the authors conclude with a carbon intensity of 51.4 gCO2e/MJ for ethanol (the “e” stands for equivalent). This is significantly reduced compared to studies done a decade or two ago, showing the result of improved practices. Most studies show the intensity reducing with time.
Perhaps more interesting is the table on the right which suggests that we are hardly done with the improvements – there are several opportunities for further reduction in the carbon intensity of ethanol, listed there.
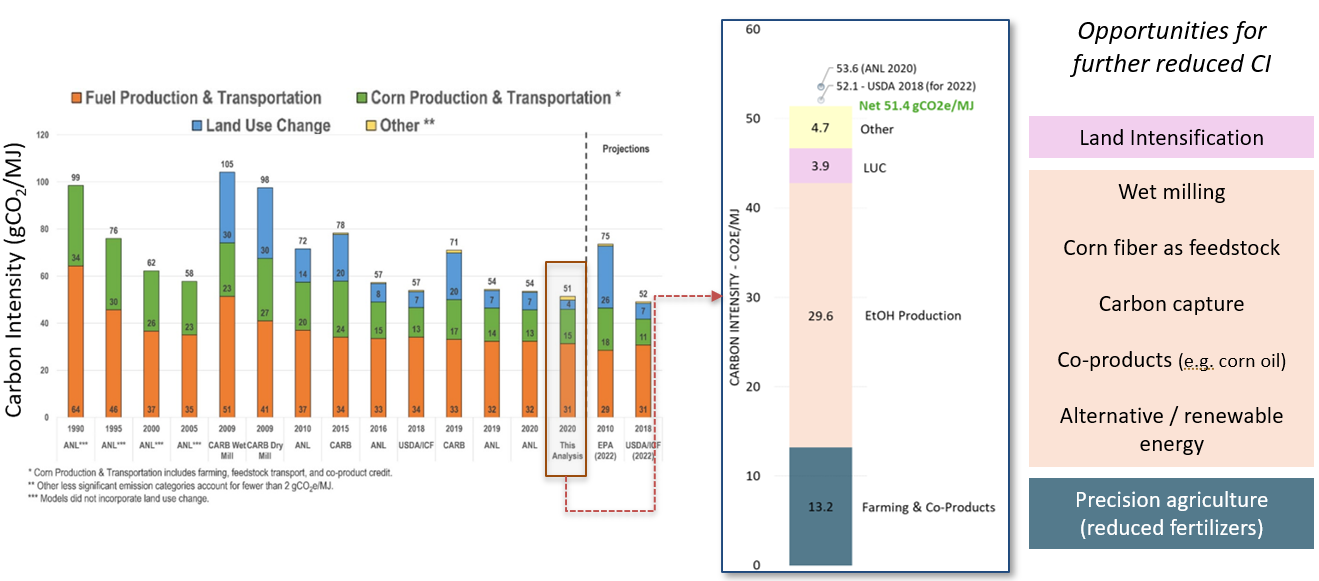
Reference for left chart:
Env. Health & Engg., MIT, Tufts Univ., Harvard T.H. Chan School of Pub. Health 2021 Environ. Res. Lett. 16 043001 DOI 10.1088/1748-9326/abde08
Final thoughts
Ethanol is expected to have an interesting trajectory given the headwinds due to electrification on one hand and the push for increased production for decarbonization of the existing fleet on the other. As mentioned in the introduction, heavy-duty is only getting started and ethanol is literally and figuratively poised to soar with its use for SAFs.
Till we use ethanol – and any other fuel for that matter – the goal should be to reduce its carbon footprint. That is certainly happening for ethanol. The efforts of farmers and fuel producers in this regard are delivering results. And that is a good thing for all end uses.
Sign up here to receive such summaries and a monthly newsletter highlighting the latest developments in transport decarbonization
5-Min Monthly
Sign-up to receive newsletter via email
Thank you!
You have successfully joined our subscriber list.
Recent Posts
Conference Summary – SAE WCX 2025
![]()
A summary of the “SAE WCX 2025” conference held in Detroit.
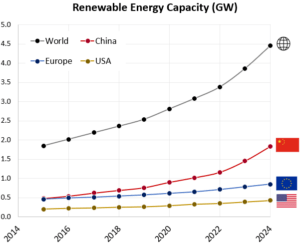
IRENA Renewable Energy Capacity Statistics 2025
![]()
According to the latest report from IRENA, 2024 saw the largest increase in renewable capacity, accounting for 92.5% of overall power additions.
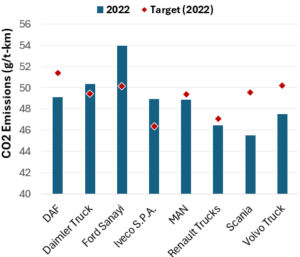
CO2 Emissions Performance of Heavy-Duty Vehicles in Europe – 2022 Results
![]()
The European Commission has published the official 2022 CO2 emission results for heavy-duty vehicles. Many OEMs are ahead of the targets and have gained credits, while others have their work cut out as we approach the 2025 target.

