Highlights from the IEA report on the future of e-mobility
Reference: “Global EV Outlook 2022”
State of electrification today
- Passenger cars: 6.6 million EVs were sold in 2021, representing ~ 10% share of overall sales. In Q1 2022, already 2 million EVs were sold. EV share of new sales was 17% in Europe (25% in Germany).
- Battery price: Average battery pack was $132/kWh in 2021. If material constraints continue, the price is expected to increase by 15% in 2022.
- China is leading
- One in every two EV cars sold globally was in China, where EVs cost on average only 10% higher than conventional vehicles. In other markets, EVs cost 45-50% higher.
- 50% of China’s new 2- and 3-wheelers sales were electric.
- 90% of electric buses and trucks were sold in China
- China has >50% processing and refining capacity of Li, Co and graphite. It produces 75% of all Li-ion batteries, 70% of cathodes and 85% of anodes. 70% of battery production announced to 2030 is in China.
- Heavy-duty: Electric medium and heavy-duty truck (M-HDV) sales of 14,200 accounted for 0.3% of global sales, with China accounting for 90% of new registrations. Electric bus sales were ~ 90,000, most of these in China where one in 4 buses sold is an electric. Still electric bus sales are ~ 25% down since the peak in 2017.
2030 Scenarios
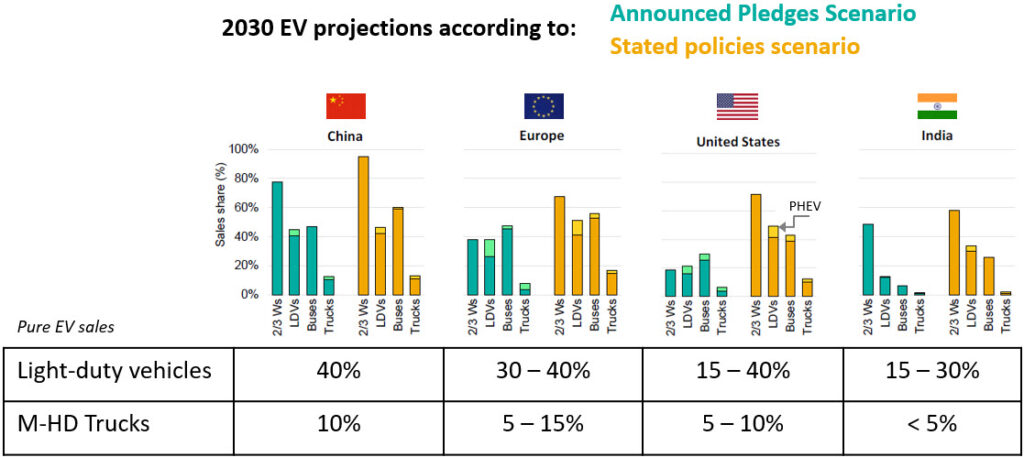
Future EV shares are projected based on existing policies and announcements. By 2030:
- Light-duty vehicle EV sales increase to 30 – 45 million in 2030, a 35 – 50% share of new sales. PHEVs to account for ~ 10% of the EVs.
- M-HD truck EV sales increase to 7 – 10% and bus sales increase to 20 – 33%.
Electric two and three-wheelers account for 40 – 55 million by 2030, a share of up to 65% of new sales
Batteries
The bottleneck is raw materials
To reach the above levels of electrification will require 2.2 – 3.5 TWh of batteries, translating to an additional 52 – 90 gigafactories by 2030. Cars account for 85% of the demand.
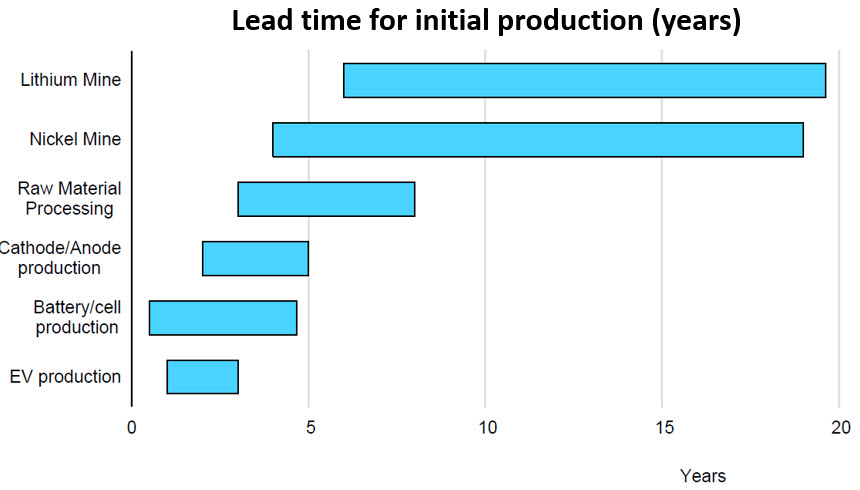
Announced battery production stands at 4.6 TWh, higher than the demand. However, the bottleneck will be raw material supply. The lead time for a lithium and nickel mine to begin commercial production is 4 – 20 years.
Electricity
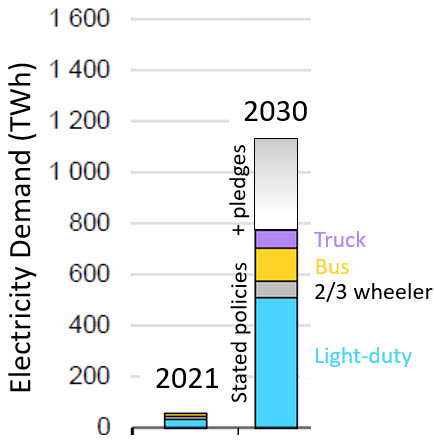
A big increase but a small fraction of overall use
EVs will consume an additional 780 – 1100 TWh of electricity by 2030, projected to be ~ 3 – 4% of the total electricity demand.
Charging infrastructure
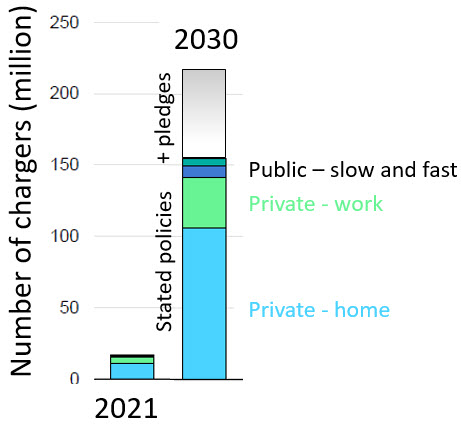
There can never be enough chargers, right ?
For electric cars, 22 million charging points need to be added each year till 2030 to meet the expected growth in these scenarios.
So what’s the end benefit ?
Ultimately, we are hopefully doing all of this to address the issue of climate change and reduce greenhouse gas emissions. Hence it is important to look at the projected GHG reduction benefits of electrification.
On a well-to-wheel basis, electrification in the two scenarios lead to reduced GHG emissions of 460 – 580 million tons of CO2-eq. by 2030. The 2022 report from the Intergovernmental Panel on Climate Change notes that global emissions from the transportation sector were 8.5 Gigatons (that is 8,500 million tons) in 2019.
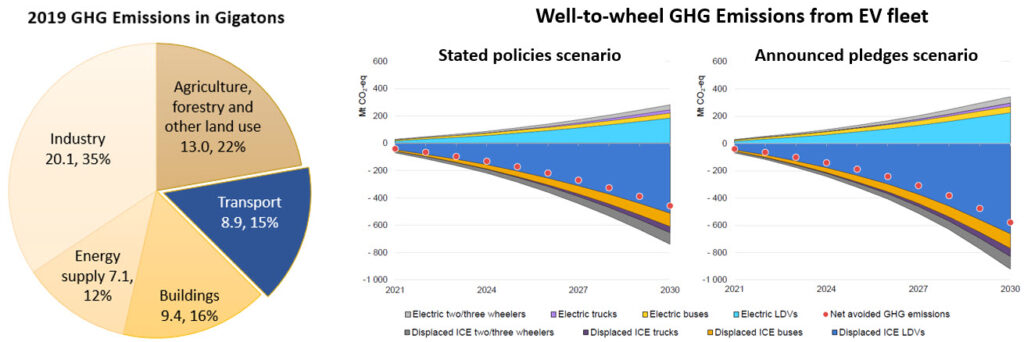
Note: Left image is made by author based on IPCC report, right image is from the IEA report.
So electrification will offset ~ 7% GHG emissions from the global transportation sector by 2030. To put that in context, Covid-related slowdown in economy led to a ~ 10% reduction in CO2 emissions from all sectors combined.
So yes, the CO2 reduction is significant in overall magnitude but makes a very small dent by 2030 – the real gains will be seen in later years when increased electrification will be “fueled” with electricity with even lower carbon intensity.
If you like such content, check out the monthly newsletter covering the latest on sustainable transportation technologies and regulations. Sign up below.
Like it ? Share it !
Other recent posts
Conference Summary – SAE WCX 2025
![]()
A summary of the “SAE WCX 2025” conference held in Detroit.
IRENA Renewable Energy Capacity Statistics 2025
![]()
According to the latest report from IRENA, 2024 saw the largest increase in renewable capacity, accounting for 92.5% of overall power additions.
CO2 Emissions Performance of Heavy-Duty Vehicles in Europe – 2022 Results
![]()
The European Commission has published the official 2022 CO2 emission results for heavy-duty vehicles. Many OEMs are ahead of the targets and have gained credits, while others have their work cut out as we approach the 2025 target.

